All posts by

Powerburn

Home –> Natural Gas Main –> Powerburn


Jump: | Intraday Powerburn | Intraday Natural Gas Vs Competitor Fuels | Intraday Electricity Generation | Daily Data


What Is Powerburn?
Powerburn is natural gas burned for the purpose of electricity generation. During the summer months, it is the leading single component of daily natural gas demand. One of its main uses from an analytical standpoint is a metric for the competitiveness of natural gas versus other fuels. This makes powerburn less temperature-dependent than other elements of natural gas demand and it serves as a useful proxy for the looseness/tightness of the gas market.


Intraday Powerburn


Departure Of Intraday Powerburn From 30-Day Average By ISO Region
The 7 US Independent System Operators (ISO) are tracked–
CAISO, SPP, MISO, ERCOT, PJM, NYISO, and NEISO–as well as the Northwest’s BPA. ISOs are a collective of regional electrical grids that release public data on their ouput. See more on ISOs HERE. Grayed out regions on the map below represent areas not served by these ISOs for which official data is not available.


Natural gas powerburn is determined by total US electricity demand and the percentage of this demand that is met by natural gas versus other fuels such as coal, nuclear, wind, etc.


Powerburn = Total Electricity Generation x % Of Generation Met By Natural Gas x μ
where μ = Constants & Coefficients


US electricity demand is determined by time of day (demand is higher during the day time when lights and appliances are on) and temperature (very hot or cold temperatures–the former more than the latter–boost demand).

The percentage of demand met by natural gas is determined by the price of natural gas versus competitor fuels, primarily coal. When natural gas is expensive relative to its competitors, fuel switching occurs and powerburn declines. There is also a contribution from the weather with displacement from renewables such as solar, hydroelectric, and wind dictated by the availability of these resources.

Both nationwide electricity demand and the percentage supplied by natural gas are shown in the figures below. All intraday data below is updated hourly while daily data is updated around 1 AM EDT


Natural Gas As A % Of US Electricity Generation


U.S. Utility Electricity Generation By Fuel Type


Percent Natural Gas Consumption By ISO Region


Current US Utility Electricity Generation


Daily Powerburn, US Electricity & Natural Gas Generation


Disclaimer: Natural Gas & Oil Storage Projections, Intraday Natural Gas Stats, Renewable Energy Stats, Morning Reports, and fundamental pricing models are released by Celsius Energy as experimental products. While they are intended to provide accurate, up-to-date data, they should not be used alone in making investment decisions, or decisions of any kind. Celsius Energy does not make an express or implied warranty of any kind regarding the data information including, without limitation, any warranty of merchantability or fitness for a particular purpose or use. See full Privacy Policy HERE.

Week 3 Storage

Home –> Natural Gas Inventories –> Near-Term Natural Gas Storage Projections –>Week 3

Jump To: | Week 1 Storage | Week 2 Storage | Week 3 Storage | Week 4 Storage |


Storage Projection Interpretation
Based on the 5-year historical range, maximum, and minimum, the projected natural gas storage injection or withdrawal is assigned a score from -10 to +10, to assess the bearishness or bullishness of the report, respectively. A score of +/-10 corresponds to a projection that would be either the most bearish or bullish report over the past five-years while a score of 0 is equal to the five-year average. Scores increasing from 0 to -10 are more and more bearish while scores from 0 to +10 are increasingly bullish.


Historical Comparison


Disclaimer: Natural Gas & Oil Storage Projections, Intraday Natural Gas Stats, Renewable Energy Stats, Morning Reports, and fundamental pricing models are released by Celsius Energy as experimental products. While they are intended to provide accurate, up-to-date data, they should not be used alone in making investment decisions, or decisions of any kind. Celsius Energy does not make an express or implied warranty of any kind regarding the data information including, without limitation, any warranty of merchantability or fitness for a particular purpose or use. See full Privacy Policy HERE.

Week 4 Storage

Home –> Natural Gas Inventories –> Near-Term Natural Gas Storage Projections –>Week 4

Jump To: | Week 1 Storage | Week 2 Storage | Week 3 Storage | Week 4 Storage |


Storage Projection Interpretation
Based on the 5-year historical range, maximum, and minimum, the projected Natural Gas storage injection or withdrawal is assigned a score from -10 to +10, to assess the bearishness or bullishness of the report, respectively. A score of +/-10 corresponds to a projection that would be either the most bearish or bullish report over the past five-years while a score of 0 is equal to the five-year average. Scores increasing from 0 to -10 are more and more bearish while scores from 0 to +10 are increasingly bullish.


Historical Comparison


Disclaimer: Natural Gas & Oil Storage Projections, Intraday Natural Gas Stats, Renewable Energy Stats, Morning Reports, and fundamental pricing models are released by Celsius Energy as experimental products. While they are intended to provide accurate, up-to-date data, they should not be used alone in making investment decisions, or decisions of any kind. Celsius Energy does not make an express or implied warranty of any kind regarding the data information including, without limitation, any warranty of merchantability or fitness for a particular purpose or use. See full Privacy Policy HERE.

Week 2 Storage

Home –> Natural Gas Inventories –> Near-Term Natural Gas Storage Projections –>Week 2

Jump To: | Week 1 Storage | Week 2 Storage | Week 3 Storage | Week 4 Storage |


Storage Projection Interpretation
Based on the 5-year historical range, maximum, and minimum, the projected natural gas storage injection or withdrawal is assigned a score from -10 to +10, to assess the bearishness or bullishness of the report, respectively. A score of +/-10 corresponds to a projection that would be either the most bearish or bullish report over the past five-years while a score of 0 is equal to the five-year average. Scores increasing from 0 to -10 are more and more bearish while scores from 0 to +10 are increasingly bullish.


Historical Comparison


Disclaimer: Natural Gas & Oil Storage Projections, Intraday Natural Gas Stats, Renewable Energy Stats, Morning Reports, and fundamental pricing models are released by Celsius Energy as experimental products. While they are intended to provide accurate, up-to-date data, they should not be used alone in making investment decisions, or decisions of any kind. Celsius Energy does not make an express or implied warranty of any kind regarding the data information including, without limitation, any warranty of merchantability or fitness for a particular purpose or use. See full Privacy Policy HERE.

Week 1 Storage

Home –> Natural Gas Inventories –> Near-Term Natural Gas Storage Projections –>Week 1

Jump To: | Week 1 Storage | Week 2 Storage | Week 3 Storage | Week 4 Storage |


Storage Projection Interpretation
Based on the 5-year historical range, maximum, and minimum, the projected storage injection or withdrawal is assigned a score from -10 to +10, to assess the bearishness or bullishness of the report, respectively. A score of +/-10 corresponds to a projection that would be either the most bearish or bullish report over the past five-years while a score of 0 is equal to the five-year average. Scores increasing from 0 to -10 are more and more bearish while scores from 0 to +10 are increasingly bullish.


Historical Comparison


Disclaimer: Natural Gas & Oil Storage Projections, Intraday Natural Gas Stats, Renewable Energy Stats, Morning Reports, and fundamental pricing models are released by Celsius Energy as experimental products. While they are intended to provide accurate, up-to-date data, they should not be used alone in making investment decisions, or decisions of any kind. Celsius Energy does not make an express or implied warranty of any kind regarding the data information including, without limitation, any warranty of merchantability or fitness for a particular purpose or use. See full Privacy Policy HERE.

Weather Data


The biggest single determinant of natural gas demand is temperature. Cold temperatures during the winter drive heating demand while hot weather during the summer stimulates cooling demand and powerburn. Analysis of near- and long-tern weather patterns allows the talented trader to anticipate changes in natural gas supply/demand balance and their impact on natural gas price. Data and maps for current day, near term (2-14 day), extended term (2-week to 6 month), and historical weather data are presented on this page. Click any of the four quadrants in the table below for further information.

Intraday Weather

Live nationwide temperature and natural gas-weighted degree day data and maps based on reports from 210 recording stations, updated hourly throughout the day.

Click above for more intraday data

Near-Term Forecast

Computer model data and maps for the 2-14 day range updated four times per day.

Click above for more near-term forecast data
Extended Outlook

Long term temperature outlook and trends for the 2-week to 6-month timeframe. Maps and data updated daily.

Click above for more extended-term forecast data
Historical Weather

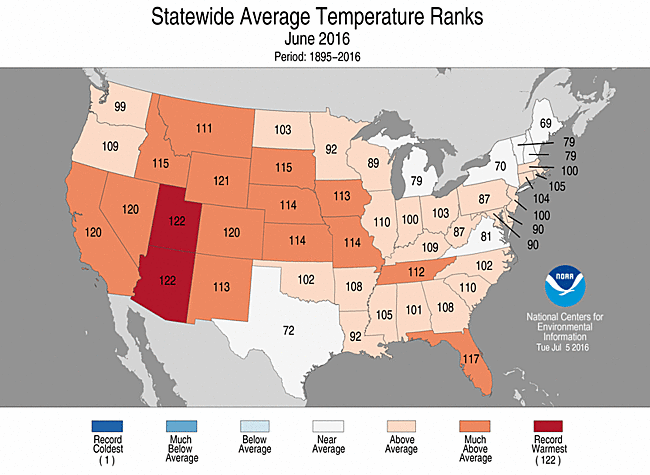
Temperature and degree day data for the past year on a weekly and monthly scale. Data updated weekly.

Click above for more historical weather data


Disclaimer: Natural Gas & Oil Storage Projections, Intraday Natural Gas Stats, Renewable Energy Stats, Morning Reports, and fundamental pricing models are released by Celsius Energy as experimental products. While they are intended to provide accurate, up-to-date data, they should not be used alone in making investment decisions, or decisions of any kind. Celsius Energy does not make an express or implied warranty of any kind regarding the data information including, without limitation, any warranty of merchantability or fitness for a particular purpose or use. See full Privacy Policy HERE.
Nuclear

Home –> Alternative Energy Main –> Nuclear Generation


Jump To:

–>Current Nuclear Output & Outages


–>Historical Nuclear Output & Outages


–>Nuclear Power & Natural Gas Demand


Nuclear Power In The United States

In the United States, nuclear power supplies 101 Gigawatts, meeting approximately 19% of the nation’s energy needs. The US is the largest supplier of commercial nuclear power in the world. 99 commercial reactors are currently under operation at 65 different facilities. Because it is difficult to rapidly ramp up or turn down a reactor, nuclear power plants supply the “base load” of US electrical demand while peak demand, during heatwaves and their associated spike in cooling demand, is handled by coal- and gas-powered plants. However, like most electrical generators, nuclear reactors must be routinely maintained and refueled every 18-24 months, requiring a shutdown of the reactor. While a reactor can be refueled in as little as 10 days, operators typically schedule non-critical maintenance during refueling periods, meaning that the average down-time is closer to 2 months. Such shutdowns usually occur during the demand-minimum (“the Shoulder Season”) during the spring and fall when as much as 25% of US nuclear capacity may be offline at any given time. It usually falls to natural gas to make up for the lost electricity generation. A general rule of thumb is that for every 2000 megawatts that goes offline, 500 mmcf of natural gas per day must be burned to generate the same quantity of electrical power. Because of the long-term nature of nuclear reactor downtime, major deviations from historical averages in the status of nuclear power plants can add up and significantly impact natural gas demand, particularly during the otherwise anemic shoulder season. All data presented here is courtesy of the Nuclear Regulator Commission (NRC).Unlike wind, solar, and hydro, nuclear power above all satisfies baseload demand and does not vary significantly throughout the day. As a result, the outages and output reported here are for the entire 24-period and are published once daily around 7 AM EDT once the NRC issues its daily outlook. For natural gas substitution demand for the entire storage week, weekend outages are based on Friday’s outages.


Nuclear Output Vs Natural Gas Demand


Summary


Current Nuclear Outages


Disclaimer: Natural Gas & Oil Storage Projections, Intraday Natural Gas Stats, Renewable Energy Stats, Morning Reports, and fundamental pricing models are released by Celsius Energy as experimental products. While they are intended to provide accurate, up-to-date data, they should not be used alone in making investment decisions, or decisions of any kind. Celsius Energy does not make an express or implied warranty of any kind regarding the data information including, without limitation, any warranty of merchantability or fitness for a particular purpose or use. See full Privacy Policy HERE.

Natural Gas Investing

Home –> Oil & Natural Gas Investing –> Natural Gas Investing

Jump To:

–>Intraday Quotes

–>Natural Gas ETFs

–>Natural Gas ETF Holdings **New**

–>Positions & Convictions Of Natural Gas Traders

–>Natural Gas Fair Price Analysis


Intraday Natural Gas Quotes


Natural Gas ETFs


Natural Gas ETF Holdings

Natural gas ETFs such as UNG, BOIL, and UGAZ must hold futures contracts in order to track the commodity’s day-to-day changes. The funds must rollover these contracts a week or so prior to expiration in order to avoid taking delivery of physical product. The charts below show the current futures contract holdings of these products.

UNG Holdings:


The most popular and un-levereged Natural Gas ETF, UNG, rolls over about 1 week after its leveraged counterparts, completing the transition about 10 days prior to expiration of the front month contract.

Source:USCF Investments

UGAZ & DGAZ Holdings


The 3x leveraged ETFs, UGAZ and its inverse counterpart DGAZ, roll over earlier than UNG, completing the roll 15-20 days prior to expiration of the front-month contract.

Source:VelocityShares


Natural Gas Fair Price Analysis


What Is The Natural Gas Fair Price?

The “Fair Price” of natural gas is an estimate of a neutral valuation for natural gas based on the current gas surplus or deficit versus the 5-year average. The natural gas departure from average is compared to weeks in the previous 5 years with a similar surplus or deficit and calculating the average price of natural gas at those times. Because natural gas is valued not only by current supply and demand but by the predicted state of the market, this Fair Price calculation is performed based on projected storage levels on a weekly basis. This data is shown on the graph to the left. If the current Futures Price is below the Fair Price, the commodity is said to be undervalued with prices more likely to rally than pullback. If the Futures Price is above the Fair Price, the commodity is said to be overvalued with prices more likely to decline. The three most important periods include current inventories alone, four weeks from now which is the maximum range for temperature forecasts, and at the end of 8 months, which is the maximum period for which projections are available. Click HERE for more details regarding storage projections on my Natural Gas Storage page.


Storage-Period Specific Fair Price


Positions & Convictions Of Natural Gas Traders


Positions & Convictions Of Natural Gas Traders

The Commodity Futures Trading Commission (CFTC) releases data and analysis on natural gas option positions each Friday afternoon at around 3:30 pm EDT for the preceding Tuesday. This includes total open interest and breakdown of long and short contracts amongst money managers, all of which is shown below. One natural gas contract represents 10,000 MMBTU’s, or about $25,000. Source: Commodity Futures Trading Commission.


Open Interest

Open interest represents the total number of contracts that have not been settled or offset by delivery. A spike in open interest often precedes an increase in volatility as more money flows into the market. A declining open interest suggests that major traders are liquidating their positions, possibly heralding an end to whatever the current trend is. The data shown below includes open interest for all contracts traded, including money managers, producers, merchants, and swap dealers.


Long Vs Short Positions Of Money Managers

The data below shows a breakdown of open long contracts versus open short contracts among money managers.


% Of Contracts Held Long Among Money Managers

The chart below is a derivative of the chart to the left and shows the percentage of all outstanding contracts among money managers that are held on the long side.


Disclaimer: Natural Gas & Oil Storage Projections, Intraday Natural Gas Stats, Renewable Energy Stats, Morning Reports, and fundamental pricing models are released by Celsius Energy as experimental products. While they are intended to provide accurate, up-to-date data, they should not be used alone in making investment decisions, or decisions of any kind. Celsius Energy does not make an express or implied warranty of any kind regarding the data information including, without limitation, any warranty of merchantability or fitness for a particular purpose or use. See full Privacy Policy HERE.

Intraday Weather Data

Homepage –> Temperature & Weather Data Home –> Intraday Weather


Current Intraday Nationwide Temperatures

Nationwide temperature data is calculated by weighting the top 210 cities in the United States by population to generate a mean intraday total. Temperature data is updated hourly based on publicly available NWS weather station data.


Current Intraday Natural Gas Weighted Degree Days (GWDDs)

Gas Weighted Degree Days are a proprietary metric that integrates heating and cooling demand to provide an estimate of natural gas demand where higher numbers correlate with higher demand. GWDDs are updated hourly.


Current US Temperatures

Source: Weather.com


24-Hour Temperature Change

Source: Weather.com


Current US Extremes

Intraday hottest and coolest temperatures as well as highest 24 hour rainfall (or snowfall liquid equivalent) for US cities with a population over 150,000.


Disclaimer: Natural Gas & Oil Storage Projections, Intraday Natural Gas Stats, Renewable Energy Stats, Morning Reports, and fundamental pricing models are released by Celsius Energy as experimental products. While they are intended to provide accurate, up-to-date data, they should not be used alone in making investment decisions, or decisions of any kind. Celsius Energy does not make an express or implied warranty of any kind regarding the data information including, without limitation, any warranty of merchantability or fitness for a particular purpose or use. See full Privacy Policy HERE.

Natural Gas Storage


An array of natural gas storage data is available, including “official” inventories as reported by the EIA, daily projections and estimated intraday current inventories, near-term weekly projections, and long-term forecasts. These projections are derived from a combination of observed natural gas pipeline data, near-term computer model temperature forecasts, and extended-term temperature forecast trends. Click your dataset from the boxes below.


Latest EIA-Reported Natural Gas Inventories

Updated Thursday at 10:30 AM EDT with the EIA’s Storage Report for natural gas inventories as of the previous Friday. Also includes data on the current withdrawal season with historical context.

Click above for more EIA storage data

Intraday Natural Gas Inventories

Projected daily storage injection or withdrawal and estimated intraday natural gas inventories. Updated hourly throughout the day based on temperature and pipeline data.

Click above for more intraday storage data
Near-Term Natural Gas Storage Projections

Weekly storage projections for the next 4 weeks, including daily injection & withdrawal data, inventory levels, and historical context. Updated twice per day at 7 AM and 7 PM EDT.

Click above for more near-term natural gas storage data
Long-Term Natural Gas Storage Projections

Experimental long-term projection data based on extended temperature trends and current supply/demand balance. Includes withdrawal season-ending projections & weekly storage forecasts for the next 8 months.

Click above for more long-term projection data


Disclaimer: Natural Gas & Oil Storage Projections, Intraday Natural Gas Stats, Renewable Energy Stats, Morning Reports, and fundamental pricing models are released by Celsius Energy as experimental products. While they are intended to provide accurate, up-to-date data, they should not be used alone in making investment decisions, or decisions of any kind. Celsius Energy does not make an express or implied warranty of any kind regarding the data information including, without limitation, any warranty of merchantability or fitness for a particular purpose or use. See full Privacy Policy HERE.