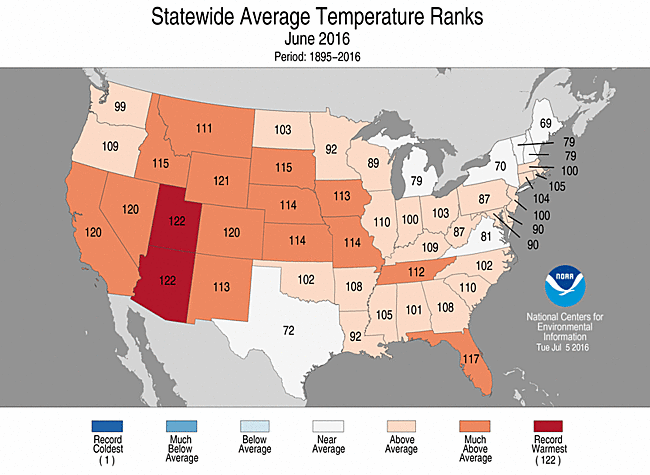
The biggest single determinant of natural gas demand is temperature. Cold temperatures during the winter drive heating demand while hot weather during the summer stimulates cooling demand and powerburn. Analysis of near- and long-tern weather patterns allows the talented trader to anticipate changes in natural gas supply/demand balance and their impact on natural gas price. Data and maps for current day, near term (2-14 day), extended term (2-week to 6 month), and historical weather data are presented on this page. Click any of the four quadrants in the table below for further information.
|
|
Disclaimer: Natural Gas & Oil Storage Projections, Intraday Natural Gas Stats, Renewable Energy Stats, Morning Reports, and fundamental pricing models are released by Celsius Energy as experimental products. While they are intended to provide accurate, up-to-date data, they should not be used alone in making investment decisions, or decisions of any kind. Celsius Energy does not make an express or implied warranty of any kind regarding the data information including, without limitation, any warranty of merchantability or fitness for a particular purpose or use. See full Privacy Policy HERE.


