
All posts by
Protected: Daily Commentary
Protected: August 26, 2026
Daily Commentaries
Home –> Daily Commentary
6:00 AM EDT, Monday, August 24, 2026
Natural gas prices bounced back on Friday as investors sought support in continued heat across the Deep South as well as in alarmingly low European inventories.
The front-month September 2026 contract rose by 3 cents or 1.2% to settle at $2.77/MMBTU, reclaiming roughly half of Thursday’s post-EIA drop. Natural gas ETFs, on the other hand, were more split due to some selling pressure after the 2:30 PM ET close of floor trading thanks to a milder 12Z run of the ECWMF. 1x UNG shed 0.2% while 2x BOIL, which holds T+2 November 2026 contracts, still managed a small +0.4% gain. On the week, the commodity registered a small +1.5% gain, its second straight.
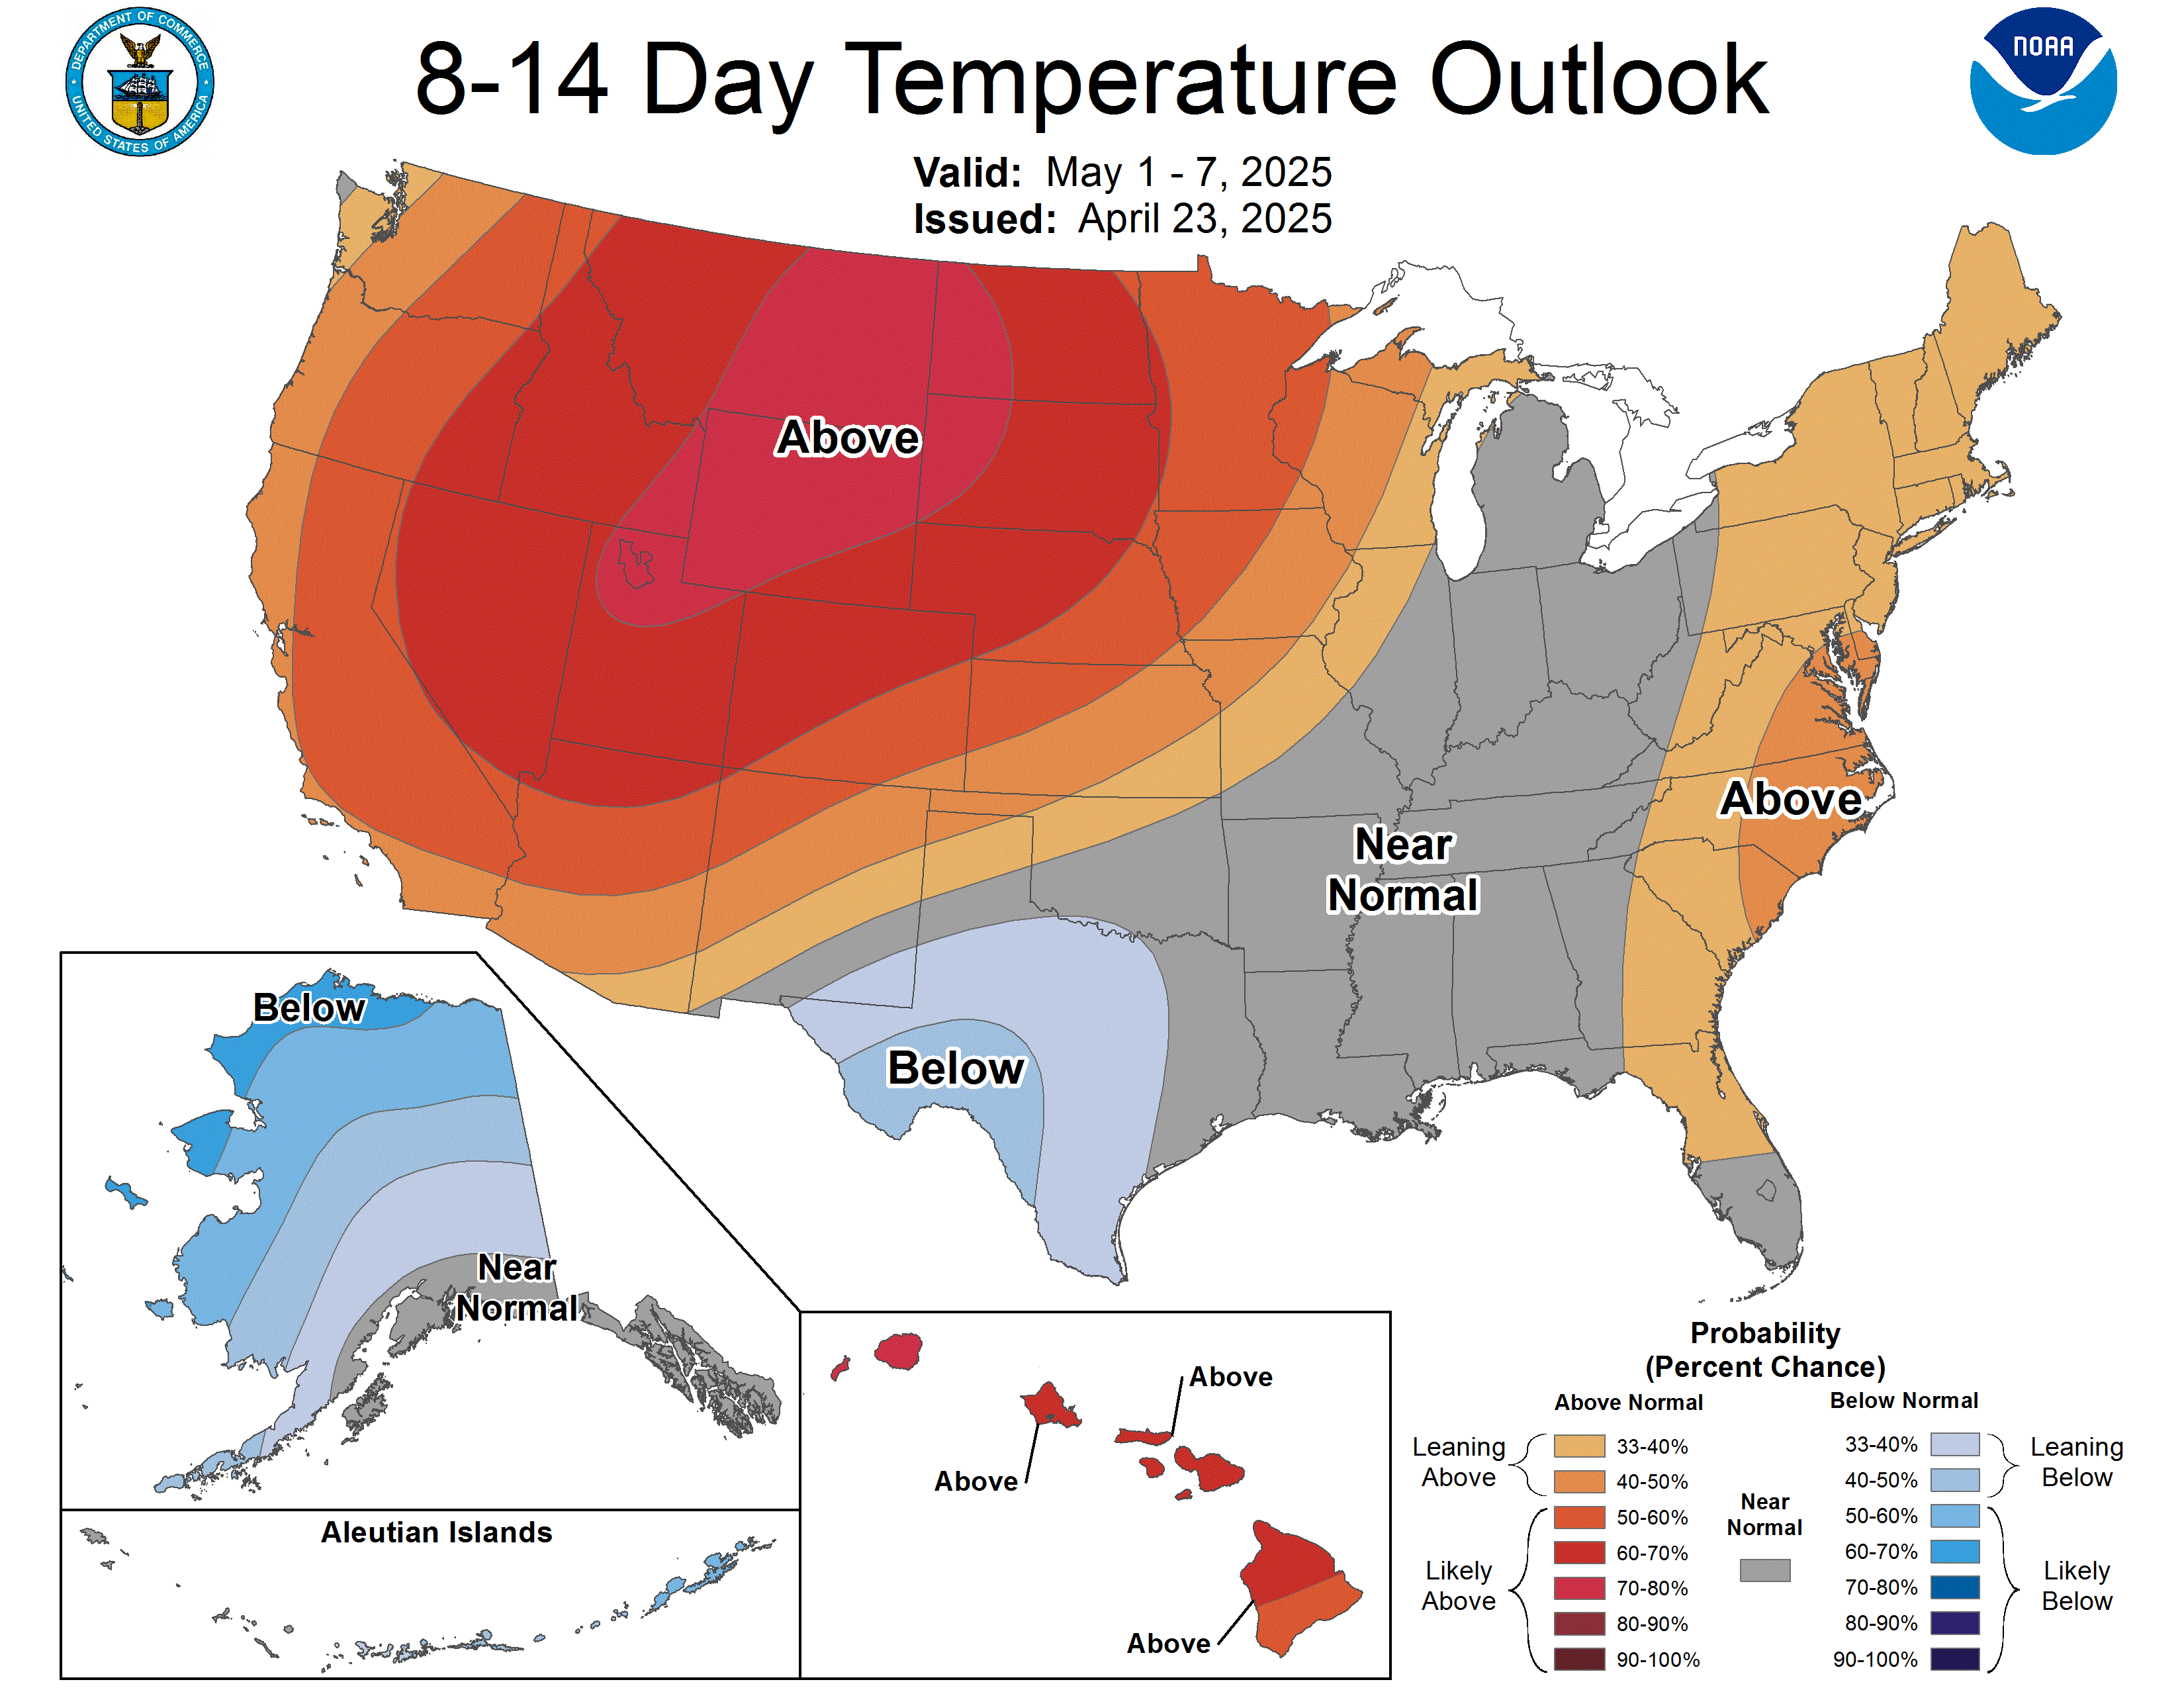
Despite cooler conditions across the Northern Tier, unseasonably hot conditions are expected to continue across the nation’s largest natural gas-consuming state of Texas at least through the first week of September. This is reflected in the National Weather Service’s 8-14 day outlook in the Figure to the right.
This heat dome alone will more than cancel out cooler conditions further to the north. As of early Monday morning, my Consensus Model—which integrates a performance-based average of GFS OP, GFS ENS, and ECWMF ENS data—was calling for 174 Gas-Weighted Degree Days (GWDDs) for August 24-September 6, +19 GWDDs greater than the 5-year average and still the single most for the period in the last 5 years. This forecast was largely unchanged over the weekend.
The result of this patten will be daily natural gas storage injections that are consistently slightly bullish versus the 5-year average. By September 6, I project that the storage surplus versus the 5-year average will be under +150 BCF from its currently +170 BCF while the year-over-year deficit will have more than doubled to -75 BCF.
While the domestic surplus is expected to contract, it pales in comparison to the situation in Europe. Over the weekend, the continent’s natural gas inventories finally accomplished what they had been threatening to do all Summer: drop to 5-year lows. As shown in the Figure to the right, European storage now stands at 2413 BCF while the deficit versus the 5-year average has widened to -677 BCF. Prices are elevated due to the bullish combination of the Iran War that has cut LNG transits of the Strait of Hormuz, unseasonably hot temperatures across the continent, and relatively weak wind generation. On the current trajectory, inventories will peak for the season under 2700 BCF the last week of October, more than -800 BCF below the 5-year average. Click HERE for more on the latest European storage data.
Unsurprisingly, this has been bullish for European natural gas prices. Even as domestic gas prices have floundered under $3/MMBTU this Summer, the TTF European continental price point has climbed back above 2026 highs in recent weeks and, at $21.05/MMBTU, is up a massive 97% year-over-year.
While US prices won’t necessarily go up just because global prices are lofty, the large spread between the US and European prices (and Asian prices, for that matter) will support strong domestic LNG export demand. And this will be a long-term, sustained tailwind as a storage surplus of this magnitude is not going to correct quickly. Near-term, this could once again become a reliable bullish catalyst this Fall as temperature-driven demand fades in the Shoulder Season and as Freeport returns from prolonged maintenance and as Golden Pass continues to ramp up.
At this time, I remain cautiously bullish on the sector. I am maintaining a $3.00/MMBTU upside target on the September and October contracts or, really, the October contract with the former set to expire later this week. I remain long the sector via short KOLD and long E&Ps AR, AM, EXE, and EQT.
Over the weekend, natural gas demand fell slightly as below-average temperatures expanded across the Ohio Valley and Northeast while commercial and industrial demand saw their typical weekend dips. After a +3 BCF/day daily storage injection on Friday, projected builds rose to +6 BCF/day on both Saturday and Sunday, just above the 5-year average +5 BCF/day.
Gas demand will rise slightly today as commercial and industrial demand recovers, even as the temperature pattern remains largely unchanged. Cooler-than-normal conditions will persist across the Great Lakes into the Northeast. Buffalo, NY will be the cool spot in the mid-60s while Pittsburgh, PA will only see the lower 70s, Columbus, OH the mid-70s and Chicago, IL the upper 70s, 5F-15F below-average. Along the densely-populated I-95 Corridor, Washington, DC, Philadelphia, PA, and New York City will climb into the lower 80s, up to 5F below-average. All of these areas will see some powerburn suppression, though not to the same extent as earlier in the Summer when average temperatures across the region are hotter.
On the other hand, parts of the nation’s largest natural gas-consuming state of Texas will see some of their hottest temperatures of the season. Dallas and Abilene will reach the upper 100s, Oklahoma City, OK and Amarillo the mid-100s, and San Antonio and Houston the lower 100s, 5F-15F above-average. Hot conditions will also be found across parts of the Pacific Northwest where Portland, OR could top 90F, 10F warmer-than-normal. All of these areas will see strong late-season cooling demand.
Overall, today’s forecast mean population-weighted nationwide temperature will fall by -0.5F from Sunday to 77.2F thanks to the expanding chill across the Northern Tier, still +1.3F above-average due to the persistent heat across the South. Gas-Weighted Degree Days (GWDDs) will inch slightly lower to 12.0 GWDDs, a neutral -0.2 GWDDs fewer than the 5-year average but the third most for August 24 in the last 5 years. 2023 registered the 5-year average with an impressive 14.7 GWDDs while last year saw the 5-year low at 10.3 GWDDs. Click HERE for more on today’s temperature and degree day outlook.
Based on this forecast and early-cycle pipeline data, I am projecting a +5 BCF/day daily natural gas storage injection for today, 1.5 BCF smaller than yesterday and a slight 0.5 BCF bullish versus the 5-year average.
By tonight, projected Realtime inventories will rise to 3205 BCF while the surplus versus the 5-year average will inch lower to +171 BCF. The year-over-year deficit will contract by over 3 BCF to -27 BCF. Click HERE for more on today’s projected injection and Realtime inventories. For the rest of the week, expect gas demand to rise slightly as the mild conditions across the Ohio Valley erode while heat persists across the Deep South. By Friday, expect daily injections to fall under +4 BCF/day.
Disclaimer: Natural Gas & Oil Storage Projections, Intraday Natural Gas Stats, Renewable Energy Stats, Morning Reports, and fundamental pricing models are released by Celsius Energy as experimental products. While they are intended to provide accurate, up-to-date data, they should not be used alone in making investment decisions, or decisions of any kind. Celsius Energy does not make an express or implied warranty of any kind regarding the data information including, without limitation, any warranty of merchantability or fitness for a particular purpose or use. See full Privacy Policy HERE.

Protected: Portfolio Holdings
Protected: August 25, 2026
Protected: August 19, 2026
Long-Term Natural Gas Inventories
Home –> Natural Gas Inventories –> Long Term Natural Gas Storage
| Jump to: | Projected End-Of-Season Inventories | End-Of-Season Projection History | 8-Month Storage Projections | 8-Month Projected Surplus Or Deficit | |
|
|
|

Disclaimer: Natural Gas & Oil Storage Projections, Intraday Natural Gas Stats, Renewable Energy Stats, Morning Reports, and fundamental pricing models are released by Celsius Energy as experimental products. While they are intended to provide accurate, up-to-date data, they should not be used alone in making investment decisions, or decisions of any kind. Celsius Energy does not make an express or implied warranty of any kind regarding the data information including, without limitation, any warranty of merchantability or fitness for a particular purpose or use. See full Privacy Policy HERE.