All posts by

Extended Range Weather

Homepage –> Temperature & Weather Data Home –> Extended-Term Outlook

Jump To:

–>8-14 Day Outlook

–>3-6 Week Outlook ***New!***

–>2-6 Month Outlook


8-14 Day Temperature Outlook

The 8-14 day temperature outlook is issued by the National Weather Service Monday-Friday and updates around 3 pm EDT. It estimates the probability of a given region seeing above or below average temperatures during this period. It does not forecast the magnitude of these departures.


Week 3-6 Temperature Outlook

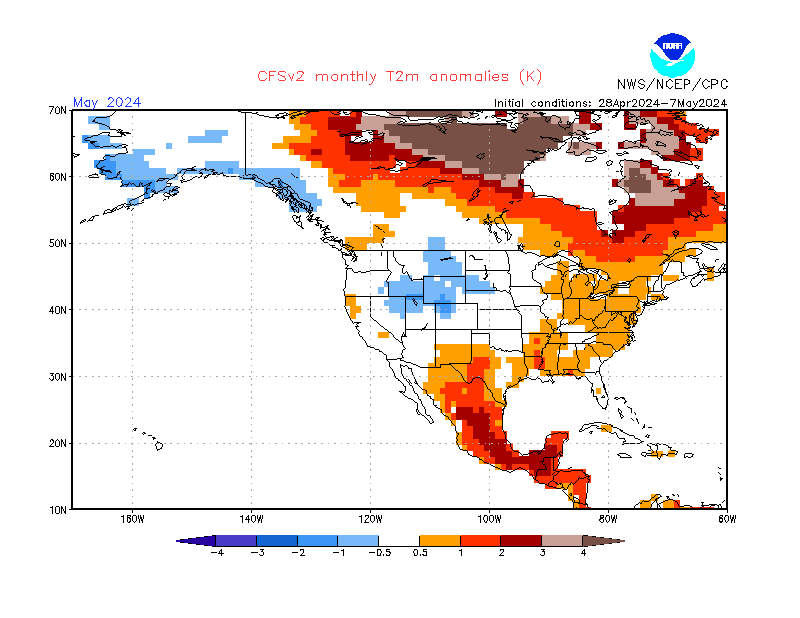
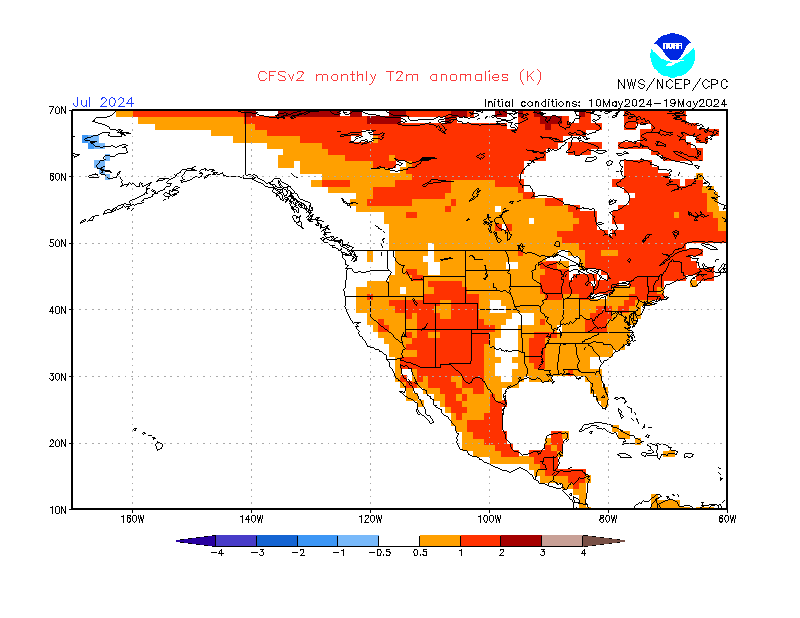
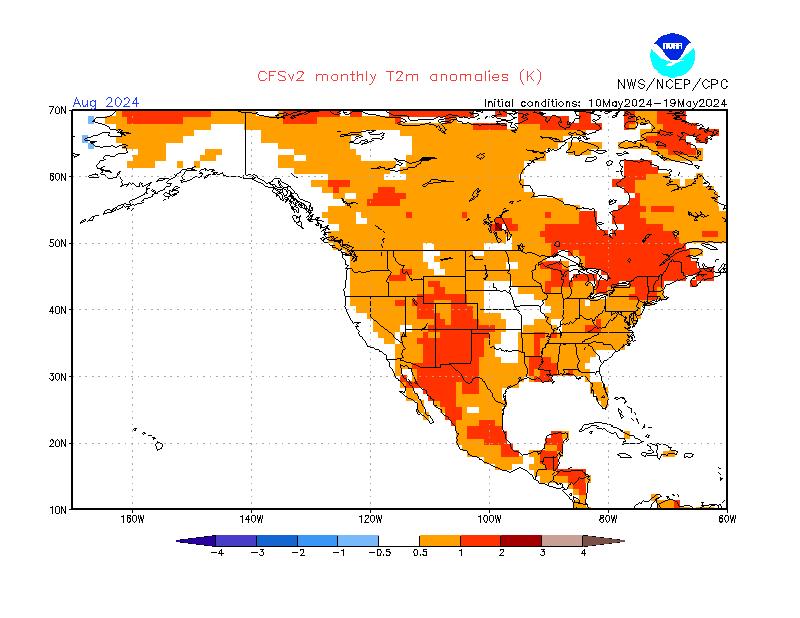
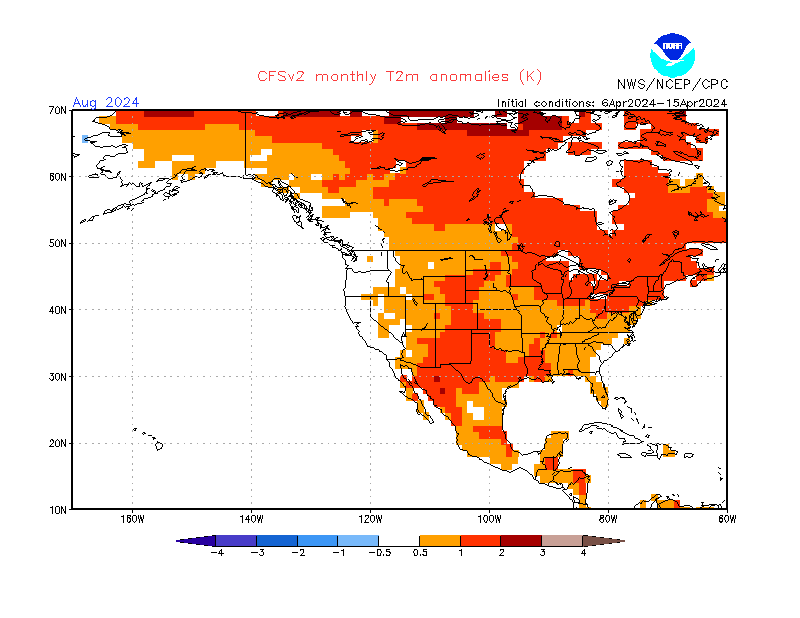
The climate prediction center (CPC) releases extended range outlooks for Week 3-6 daily through its NCEP version 2 coupled forecast system model (CFSv2). These maps plot projected weekly temperature anomalies in degrees Celsius (C). These maps update twice daily at 7 AM and 7 PM EDT. Quantitative data is displayed beneath the maps.


Data Source: Tropical Tidbits By Levi Cowan


Quantitative Week 3-6 Gas-Weighted Degree Day Outlook


Week 3-6 Model Trends
The charts below plot the projected weekly GWDDs for weeks 3-6 over the past 15 days to illustrate how these forecasts have evolved, highlighting increasing or decreasing temperature-dependent contributions to natural gas demand.


2-6 Month Forecast

Like the 3- and 4-week outlooks, the extended range 2-6 month outlook is released by the CPC based on CFSv2 model output. These maps plot projected monthly temperature anomalies in degrees Kelvin (equal to degrees Celsius). Each month from Month 2 through Month 6 is presented individually below. These maps update daily and are based on model data collected over the previous 10 days.


Disclaimer: Natural Gas & Oil Storage Projections, Intraday Natural Gas Stats, Renewable Energy Stats, Morning Reports, and fundamental pricing models are released by Celsius Energy as experimental products. While they are intended to provide accurate, up-to-date data, they should not be used alone in making investment decisions, or decisions of any kind. Celsius Energy does not make an express or implied warranty of any kind regarding the data information including, without limitation, any warranty of merchantability or fitness for a particular purpose or use. See full Privacy Policy HERE.

Markellos Page


Jump to: | Daily Commentary | Natural Gas Investing Data | Celsius Energy Portfolio | Intraday Temperature Data | Intraday Natural Gas Storage Data | Natural Gas Storage Projections | Near-Term Temperature Outlook | LNG Exports | Natural Gas Powerburn |


Latest Daily Commentary

Smaller-Than-Expected Natural Gas Storage Withdrawal Prompts 4% Sell-Off As Impending Warm-Up Also Weighs; Final Arctic Blast To Support Exceptional Demand Today & through The Weekend, Driving First -300 BCF Weekly Storage Withdrawal Before Milder Weather Arrives Next Week; LNG Feedgas Demand Rises To Record


Friday, January 5, 2018

A smaller-than-expected natural gas storage withdrawal by the EIA prompted an acceleration of Wednesday’s profit-taking as the commodity dropped over 4% to settle back under $2.90/MMBTU. In its weekly natural gas storage report for the week of December 23-29, the EIA announced that natural gas inventories declined by -206 BCF. This was the largest storage withdrawal of the 2017-2018 heating season so far and 107 BCF bullish versus the 5-year average, but came in a disappointing 18 BCF smaller than my projected -224 BCF withdrawal. Admittedly, the week included the Christmas holiday and its associated unpredictable commercial and industrial demand suppression so it is difficult to infer too much about the underlying supply/demand balance of the week. Driving the withdrawal was a large increase in demand with residential/commercial demand approaching 50 BCF/day, up 15 BCF/day from the same week last year. Powerburn was also robust at 26 BCF/day, up nearly 7 BCF/day year-over-year. Natura…

Continue Reading Full Article…


Intraday Natural Gas Pricing Data


Celsius Energy Portfolio Data


Intraday Temperature data

Intraday nationwide temperature data is calculated on a population-weighted basis using a network of 210 reporting stations. The data is updated hourly throughout the day and is compared to a 1981-present average.


Current US Temperatures

Source: Weather.com


Intraday Natural Gas Storage Data

Intraday natural gas storage is based on both forecast and observed temperatures as well as early-cycle pipeline data. Today’s projected injection or withdrawal is updated between Midnight and 1 AM and intraday storage changes are updated hourly.


Natural Gas Storage Data

4-Week Natural Gas Projected Inventories Summary


Week 1 Storage Projection Details


Week 2 Storage Projection Details


Week 3 Storage Projection Details


Week 4 Storage Projection Details


Near-Term Temperature Data


Detailed Temperature Forecast Data: Day 1

Detailed Temperature Forecast Data: Day 2

Detailed Temperature Forecast Data: Day 3

Detailed Temperature Forecast Data: Day 4

Detailed Temperature Forecast Data: Day 5

Detailed Temperature Forecast Data: Day 6

Detailed Temperature Forecast Data: Day 7


Natural Gas LNG Feedgas & Exports

Cheniere Energy’s Sabine Pass Liquefied Natural Gas(LNG) liquefaction facility is located on the Gulf Coast on the Texas/Louisiana border and became the US’ first LNG export facility in March 2016. The plant receives feedgas deliveries via Cheniere’s wholly owned Creole Trail Pipeline, an 85-mile pipeline that itself receives gas from the Transco, Natural Gas Pipeline of America (NGPL), Texas Eastern (TETCO), and Trunkline pipelines. Liquefied natural gas represents a temperature-independent source of natural gas demand that will become increasingly influential in natural gas supply/demand balance.


LNG Exports & Tankers

LNG tankers transport natural gas that has been cooled and compressed to 1/600th its original volume from Sabine Pass to markets throughout the world. Most tankers have a carrying capacity of the equivalent of 2-5 BCF of gaseous natural gas. The maps and tables below plots the positions of the active fleet of over 300 LNG tankers that have logged a position within the past 3 days.


Map Of LNG Tankers In The Western Atlantic

Natural Gas Powerburn

Powerburn is natural gas burned for the purpose of electricity generation. During the summer months, it is the leading single component of daily natural gas demand. One of its main uses from an analytical standpoint is a metric for the competitiveness of natural gas versus other fuels. This makes powerburn less temperature-dependent than other elements of natural gas demand and it serves as a useful proxy for the looseness/tightness of the gas market.


Departure Of Intraday Powerburn From 30-Day Average By ISO Region


Natural Gas Storage Contest ***NEW!***


Jump to: | Contest Summary | Submit Entry | Rankings | Schedule | Prize List | Official Rules & Disclaimer |


Contest Summary

Welcome to Celsius Energy’s Natural Gas Storage Contest! This is a 10-week contest designed to measure its participants’ skill in projecting natural gas weekly injections or withdrawals and natural gas price movements. There contest is free to enter and does not require any personal information. The contest objectives are simple. At 12 pm EDT each Thursday following the EIA’s weekly Storage Report, the contest will open for entrants to submit their projections for the natural gas storage week ending the next day (Friday) to be reported by the EIA the following Thursday. Entrants will also submit their forecast for the price of natural gas as of the close of trading the following Thursday. Entries for that week will be accepted until the following Tuesday at 5 pm EDT. See the schedule to the right for timing of entries and storage periods. Because submitting picks earlier carries increased uncertainty, entrants will be rewarded a “bonus multiple” of up to 3x their weekly score should they submit their picks right at 12 pm at the open of that week’s submission which will then decline in a linear fashion to 1x should they submit their picks right at the Tuesday 5pm close. The contest will run for a total of 10 weeks with each entrant’s 2 worst weeks discarded. Only one submission per entrant per week is allowed.


Scoring will be determined by the following equation:


Weekly Score = Bonus Multiple X {(12-storage projection error) + (0.12 – price error)x150}


11/9/2017 Scoring Addendum: Beginning in Week 2 of the contest, in order to more fairly weight the challenge in forecasting natural gas price, this component of the score will be weighted 1.5x that of the storage projection. This is reflected in the updated scoring equation above. This adjustment will not impact Week 1 scores.


For example, should an entrant miss that week’s storage injection/withdrawal by 3 BCF and that week’s closing price by $0.07/MMBTU and entered sufficiently early to earn a 2.2x bonus multiple, his/her score would be: 2.2 X (9 + 5) or 30.8. Of note, there are no negative points so if an entrant misses their storage pick by more than 12 BCF or their price pick by more than $0.12/MMBTU, they receive a 0 for that portion of their score.


Because this is the first time that I am running this contest, I reserve the right to adjust this formula on a weekly basis to ensure that the contest is as fair as possible. Any changes will be announced ahead of time and will not impact previous week’s scores.


Contest rankings will update between 6pm and 10pm each Thursday. At the end of the 10-week contest period, the top 10 scoring entrants will receive the prices shown to the right.


If you have any thoughts, questions, concerns or recommendations regarding this contest, please email me at CelsiusEnergyFM@gmail.com.


Click
HERE for full contest rules and regulations.


Submit A Pick

Prizes

1st Place: $250 USD
2nd Place: $100 USD
3rd Place: $50 USD


Contest Schedule


Current Rankings
Click For Full Rankings